Session 8: Bioinformatic pipelines
Mouse Gene Ontology enrichment analysis pipeline
Bioinformatic pipeline to carry Gene Ontology enrichment analysis for low and high divergence genes among two house mouse subspecies.
SNP variants for two mouse strains (PWD/PhJ, WSB/EiJ) were downloaded from the Mouse Genome Project FTP site (Mouse Genome Project). PWD/PhJ and WSB/EiJ represent Mus musculus musculus and Mus musculus domesticus subspecies, respectively.
The aim is to identify genes with high relative divergence between the two strains and carry Gene Ontology enrichment analysis for genes according to the divergence.
First, you have to clone the repository from the GitHub:
# Go to you project directory
cd ~/projects

# Clone repository
git clone https://github.com/vjanousk/mouse-go-analysis.git

# Go to the local repository
cd mouse-go-analysis
Install required software
For the mouse Gene Ontology pipeline three specialized genomic tools are necessary:
bedtools, vcftools or bcftools. If they are not installed, the script below will
install these tools.
./install.sh
Prepare directories
We are going to prepare directories that are use to store source data as well as
intermediate steps and final resulting data. We will create a new data directory
in your project directory
mkdir -p data/00-source-data data/01-divergence data/02-go
Define variables
Several types of variables defined. Filtering parameters provide thresholds on filtering quality and number of genes used at different stages of the pipeline.
# Filtering parameters
quality=50
readdepth=10
minnumgenes=30

# Working directories (removed from the git in .gitignore)
wd_source=data/00-source-data
wd_divergence=data/01-divergence
wd_go=data/02-go

# Source files
sourcevcf=/data-shared/mouse_go/mgp.v5.snps.dbSNP142.clean.X.vcf.gz
sourcegenes=/data-shared/mouse_go/MGI.gff3.gz
go2genes=/data-shared/mouse_go/gene_association.mgi.gz
goterms=/data-shared/mouse_go/go_terms.mgi.gz

# Processed source files
cds_db=$wd_source/mgi-cds.bed
go_db=$wd_source/go2genes.txt

# Divergence analysis output files:
annotation=$wd_divergence/annotation.tab
divergencevcf=$wd_divergence/out-vars.vcf
divergence=$wd_divergence/divergence.bed

# GO enrichment by high and low divergence regions
div_go=$wd_go/divergence_by_go.txt
Prepare CDS & GO databases
MGI.gff3.gz represents a full report containing detailed information on genes,
mRNAs, exons and CDS. For the divergence analysis only CDS are needed. CDS database
is prepared in this step and .gff3 is converted to .bed to work more easily with
the CDS data.
src/make_cds_database.sh $sourcegenes $cds_db
go_terms.mgi.gz and gene_association.mgi.gz represents GO terms and association
between genes and GO terms IDs provided by Mouse Genome Informatics
(Mouse Genome Informatics) and Gene Ontology
Consortium (Gene Ontology). In the command below joined
dataset of list of genes with GO term enrichment is prepared.
src/make_go_database.sh $go2genes $goterms $go_db
Run the pipeline step-by-step
1. Selecting SNPs that are divergent between the two strains
Other criteria used for selection is the PHRED quality and read depth (DP).
Divergent SNPs are identified using Fst function built in the vcftools. SNPs
are considered to be divergent when Fst equals 1.
src/get_divergent_variants.sh \
$quality \
$readdepth \
$sourcevcf \
$annotation \
$divergencevcf
2. Calculate the per gene divergence
Once the list of divergent SNPs between the two strains and the CDS database are created,
the divergence per gene can be calculated. Combination of bedtools tools and awk
commands is used to find SNPs overlapping CDS parts of the genes and calculate sums
and relative divergence by genes.
src/calculate_per_gene_divergence.sh \
$divergencevcf.gz \
$cds_db \
$divergence
3. Calculate the average relative divergence by Gene Ontology category
Per-gene relative divergences are used to calculate the average relative divergence
for individual GO terms. Combinatino of the built-in Unix join and sort commands
is used along with groupby that is part of the bedtools tools suite. GO dataset
is joined to dataset on with gene relative divergences. The average for every GO term
is then calculated omitting low prevalence GO terms.
src/divergence_by_go.sh \
$divergence \
$go_db \
$minnumgenes \
$div_go
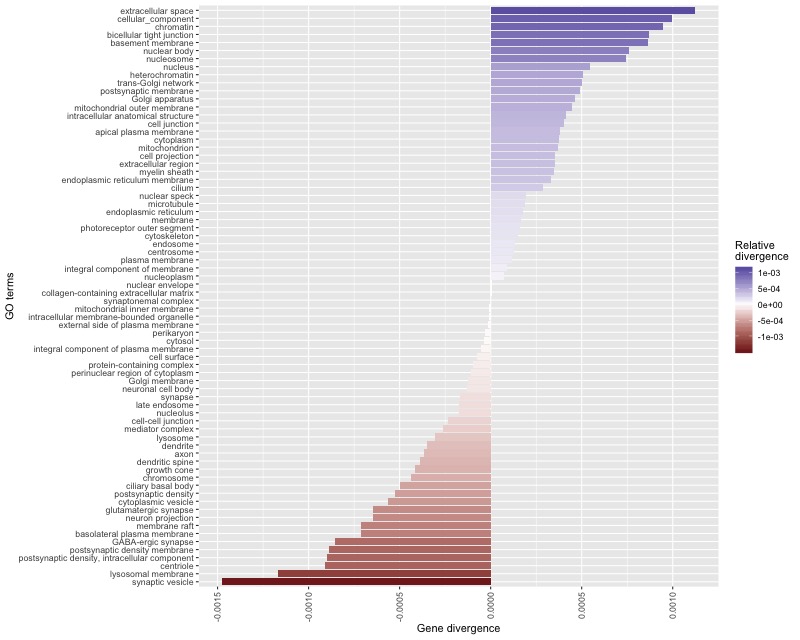
4. Prepare a barplot showing results of the GO enrichment analysis
To plot the results of the GO enrichment analysis Rscript is used. Library ggplot2
is the most suitable tool to provide fast and efficient plot.
Rscript src/plot.R
Alternatively, we can open the .R file in R Studio and plot the graph there.
Resulting ggplot graph
Run the whole pipeline at once
Now we can try to run the whole pipeline at once using pipeline.sh shell script
using different set of parameters.
# Filtering parameters
quality=50
readdepth=10
minnumgenes=30

# GO enrichment by high and low divergence regions
div_go=$wd_go/divergence_by_go-ver2.txt

# Run the pipeline
./pipeline.sh \
$quality \
$readdepth \
$minnumgenes \
$sourcevcf \
$annotation \
$divergencevcf \
$cds_db \
$divergence \
$go_db \
$div_go