Genomic tools session
A lot of command line tools available for genomics, e.g.:
- Read alignment data:
- samtools (https://samtools.github.io)
- Variant data:
- vcftools (https://vcftools.github.io/index.html)
- bcftools (https://samtools.github.io/bcftools/)
- Annotation data (genome arithmetics):
- bedtools (https://bedtools.readthedocs.io/en/latest/)
- bedops (https://github.com/bedops/bedops)
- Sequence/Alignment/Tree data:
- newick-utilities (https://github.com/tjunier/newick_utils/wiki)
- BuddySuite (https://github.com/biologyguy/BuddySuite)
Exercise
Get a population differentiation calculated as Fst between M. m. musculus and M. m. domesticus within a given sliding window and find candidate genes within highly differentiated regions:
- use
vcftoolsto filter data and calculate Fst for individual SNPs- calculate Fst for each SNP (
vcftools)- write a function that will create sliding windows for windows of different sizes and steps (
bedtools makewindows) and calculate average Fst for each window (groupBy) and calculate average Fst for sliding windows of these sizes and steps
- 100 kb + 10 kb step
- 500 kb + 50 kb step
- 1 Mb + 100 kb step
- use R-Studio and ggplot2 to plot Fst values across the genome
- use R or
tabtkto obtain the 99th percentile and use it to obtain a set of candidate genomic regions- use
bedtools intersectto get a list of candidate genes
Extract genotype data for European mouse individuals and filter out variants having more than one missing genotype and minor allele frequency 0.2 (we have already started - you should have prepared VCF file with European samples and filtered out variants with missing genomes and low minor allele frequency).
mkdir -p ~/projects/fst

cd ~/projects/fst

IN=/data-shared/mus_mda/00-popdata/popdata_mda.vcf.gz
SAMPLES=/data-shared/mus_mda/00-popdata/euro_samps.txt

vcftools --gzvcf $IN \
       --keep $SAMPLES \
       --recode --stdout |
vcftools --vcf - \
       --max-missing 1 \
       --maf 0.2 \
       --recode \
       --stdout \
    > popdata_mda_euro.vcf
Calculate Fst values for variants between M. m. musculus
and M. m. domesticus populations (populations specified in
musculus_samps.txt and domesticus_samps.txt):
MUS=/data-shared/mus_mda/00-popdata/musculus_samps.txt
DOM=/data-shared/mus_mda/00-popdata/domesticus_samps.txt
IN=popdata_mda_euro.vcf

    vcftools --vcf $IN \
       --weir-fst-pop $MUS \
       --weir-fst-pop $DOM \
       --stdout |
    tail -n +2 |
    awk -F $'\t' 'BEGIN{OFS=FS}{print $1,$2-1,$2,$1":"$2,$3}' \
    > popdata_mda_euro_fst.bed
Build function that calculates average Fst for sliding windows
# Set file name with Fst values by SNP

IN=popdata_mda_euro_fst.bed

# Make sliding windows (genome file containing info about size of chromosome has to be specified)

grep -E '^2|^11' /data-shared/mus_mda/02-windows/genome.fa.fai > genome-fst.fa.fai

GENOME=genome-fst.fa.fai

WIN=1000000
STEP=100000
NAME="1Mb"

bedtools makewindows \
           -g $GENOME \
           -w $WIN \
           -s $STEP |
awk -v win=$NAME '{ print $0"\t"win }' | less

# Intersect windows with list of SNPs

bedtools makewindows \
           -g $GENOME \
           -w $WIN \
           -s $STEP | \
awk -v win=$NAME '{ print $0"\t"win }' |
bedtools intersect \
           -a - \
           -b $IN \
       -wa -wb | less

# Calculate the average Fst by windows

bedtools makewindows \
           -g $GENOME \
           -w $WIN \
           -s $STEP | \
awk -v win=$NAME '{ print $0"\t"win }' |
bedtools intersect \
           -a - \
           -b $IN \
       -wa -wb |
sort -k4,4 -k1,1 -k2,2n |
groupBy -i - \
           -g 4,1,2,3 \
           -c 9 \
           -o mean

# We can put everything together to write a function that can be re-used for different window sizes

average_fst() {

    bedtools makewindows \
           -g $1 \
           -w $2 \
           -s $3 |
    awk -v win=$4 '{ print $0"\t"win }' |
    bedtools intersect \
           -a - \
           -b $5 \
       -wa -wb |
    sort -k4,4 -k1,1 -k2,2n |
    groupBy -i - \
           -g 4,1,2,3 \
           -c 9 \
           -o mean

}
Make three sets of sliding windows (100 kb, 500 kb, 1 Mb) and concatenate them into a single file:
IN=popdata_mda_euro_fst.bed
GENOME=genome-fst.fa.fai

# 1 Mb sliding windows with 100 kb step

average_fst $GENOME 1000000 100000 "1Mb" $IN > fst_1000kb.bed

# 500 kb sliding windows with 50 kb step

average_fst $GENOME 500000 50000 "500kb" $IN > fst_500kb.bed

# 100 kb sliding windows with 10 kb step

average_fst $GENOME 100000 10000 "100kb" $IN > fst_100kb.bed

cat fst*.bed > windows_mean_fst.tsv
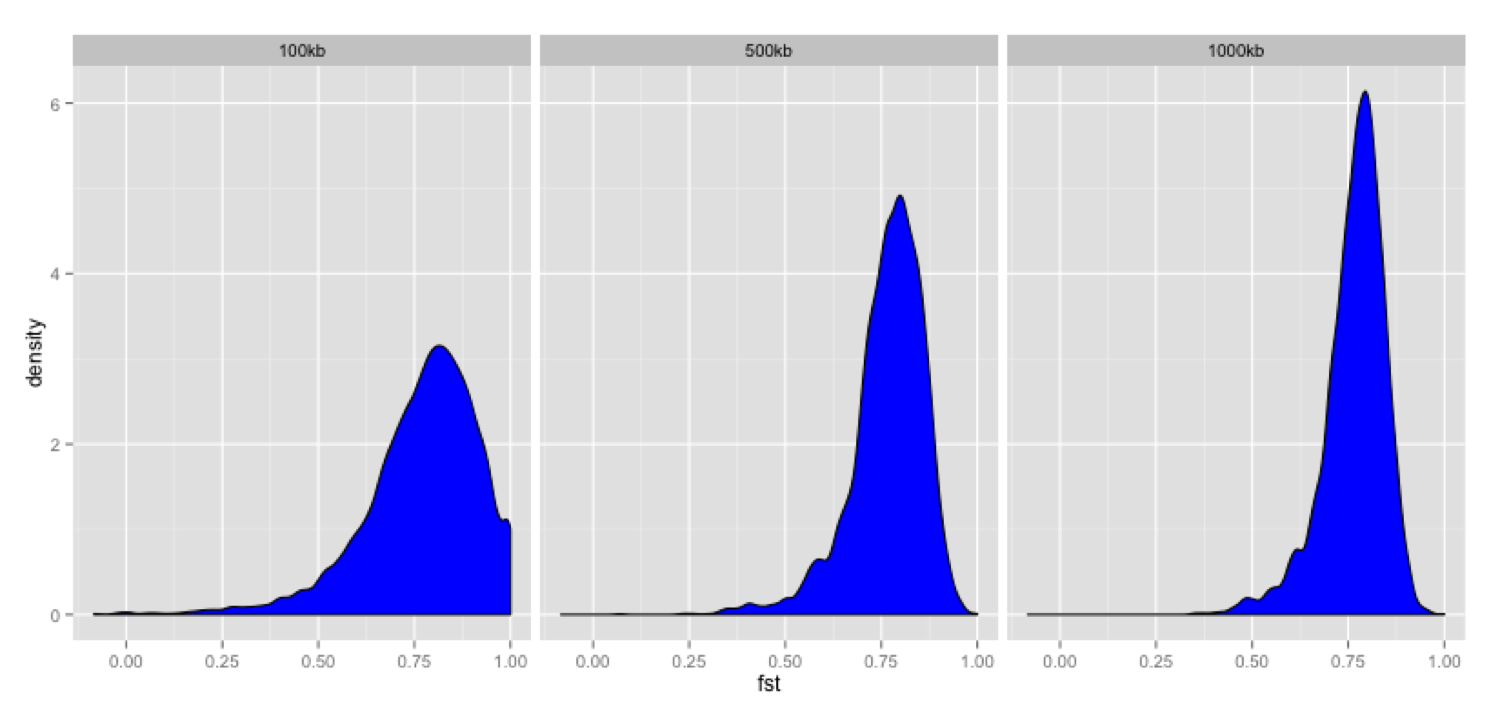
Visualize the average Fst values within the sliding windows of the three sizes between the two house mouse subspecies in R-Studio. Plot the distribution of the Fst values for the three window sizes and also plot the average Fst values along the chromosomes.
Note
R ggplot2 commands to plot population differentiation
library(tidyverse)

setwd("~/projects/fst")

## Read Fst file and rename names in header
read_tsv('windows_mean_fst.tsv', col_names=F) -> fst

names(fst) <- c("win_size", "chrom", "start", "end", "avg_fst" )

# Reorder levels for window size
fst %>%
  mutate(win_size = factor(win_size, levels=c("100kb", "500kb", "1Mb"))) ->
  fst

# Plot density distribution for average Fst values across windows
ggplot(fst, aes(avg_fst)) +
        geom_density(fill=I("blue")) +
        facet_wrap(~win_size)
## Plot Fst values along physical position
ggplot(fst, aes(y=avg_fst, x=start, colour=win_size)) +
        geom_line() +
        facet_wrap(~chrom, nrow=2) +
        scale_colour_manual(name="Window size", values=c("green", "blue","red"))

## Retrieve 99% quantiles
fst %>%
        group_by(win_size) %>%
        summarize(p=quantile(avg_fst,probs=0.99)) -> fst_quantiles

## Add 99% quantiles for 500kb window
ggplot(fst, aes(y=avg_fst, x=start, colour=win_size)) +
        geom_line() +
        facet_wrap(~chrom, nrow=2) +
        geom_hline(yintercept=as.numeric(fst_quantiles[2,2]), colour="black") +
        scale_colour_manual(name="Window size", values=c("green", "blue","red"))

Find the 99th percentile of genome-wide distribution of Fst values
in order to guess possible outlier genome regions. 99th percentile
can be obtained running R as command line or by using tabtk.
The output would be a list of windows having Fst higher
than or equal to 99% of the data.
## Calculate the 99 % quantile for average Fst for 500 kb windows
Q=$( grep '500kb' windows_mean_fst.tsv | tabtk num -c5 -q0.99 )

## Use of variables in AWK: -v q=value

grep 500kb windows_mean_fst.tsv |
  awk -v q=$Q -F $'\t' 'BEGIN{OFS=FS}$5>=q{print $2,$3,$4}' |
  sortBed |
  bedtools merge -i stdin \
        > signif_500kb.bed
Use the mouse gene annotation file to retrieve genes within the windows of high Fst (i.e. putative reproductive isolation loci).
GENES=/data-shared/bed_examples/Ensembl.NCBIM37.67.bed

    bedtools intersect \
            -a $GENES \
            -b signif_500kb.bed -wa | \
            column -t | less